Reproducible models
Tutorials for reproducing models
Each tutorial in this series is a one-command R pipeline that regenerates the tables and figures of one published spatial method, with verification checks that compare the re-run numbers against the paper. Every page follows the same four parts: method overview and reproduction scope; setup, structure and data contract; the pipeline, its results and validation; and adaptation to your own data. Code and data ship as a zip on each page, and six of the methods also run in the browser as online calculators.
Optimal Parameters-based Geographical Detector
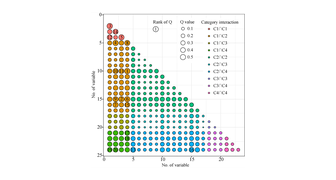
The geographical detector of spatial stratified heterogeneity, with the optimal discretisation and spatial scale searched for every continuous variable instead of chosen by habit.
Online app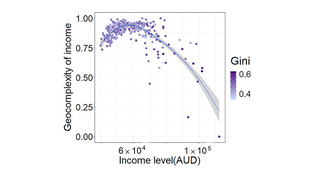
Geocomplexity
A local measure of how far a variable's neighbourhood departs from smooth spatial dependence, predicting where spatial models err and repairing part of those errors.
Online app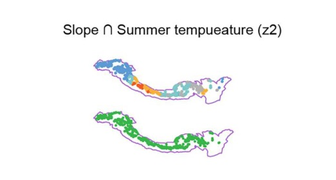
Local Indicator of Stratified Power
Measures explanatory power locally, a q-statistic inside each unit's window, and its LPI upgrade adds geocomplexity patterns as explanatory variables in their own right.
Online app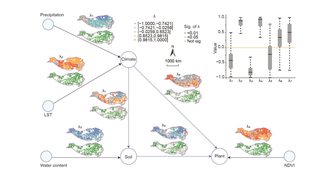
Local Pathways of Association
Path analysis made local: one structural equation model fitted inside a neighbourhood around every location, so each path coefficient becomes a surface, not a scalar.
Second Dimension of Spatial Association
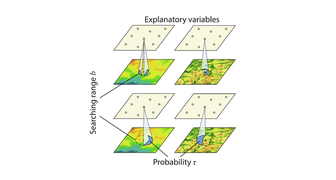
Builds variables from the environment around each sample rather than only at it — quantiles of each surface within several searching ranges — and selects among them.
Second-dimension Outlier-driven Heterogeneity
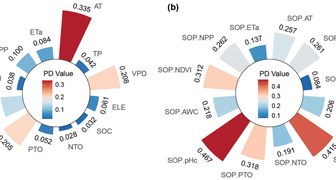
Turns local anomalies at unsampled locations into multi-scale spatial outlier patterns and measures how much heterogeneity they explain beyond the covariates themselves.
Degree of Spatial Interpretability
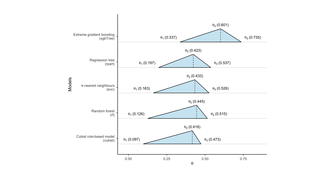
Measures how much of the data's spatial structure a prediction model actually explains rather than passes into its residuals — a question accuracy metrics cannot answer.
Online app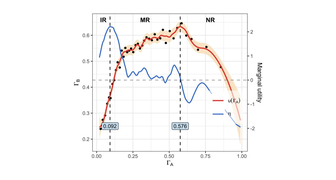
Spatial Trade-Off Relation
Measures infrastructure quantity and quality as two entropy-weighted indices, reads their relation as a utility function, and cuts it into stages of diminishing marginal utility.
Spatial Delta Model for Accessibility
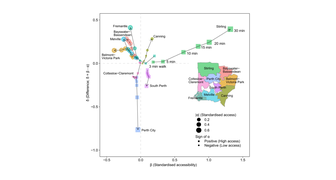
Separates how much greenspace is there (access) from how easily it can be reached and used (accessibility), reading the gap between them as a diagnosis.
Geographically Optimal Similarity
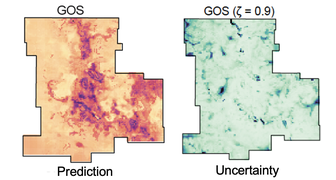
Spatial prediction on the geographical similarity principle: borrows values only from the observations whose geographical configuration most resembles the unknown location, discarding the rest.
Online app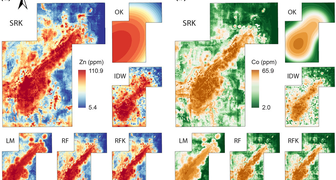
Singularity Regression Kriging
Measures how a covariate's local intensity scales with neighbourhood size, feeds that singularity index to a random forest, and kriges what the forest leaves behind.
Generalized Covariate Field
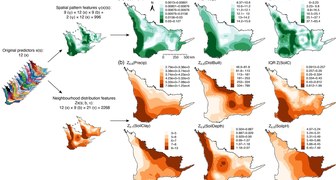
Expands the data rather than the model: every covariate becomes spatial-pattern and neighbourhood-distribution features, a stable subset is selected, and any learner predicts from them.
Online app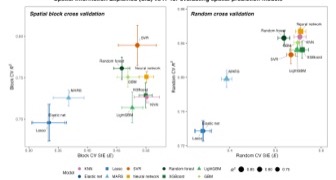
Spatial Information Explained
Measures how much of a response's spatial information a model explains: mutual information of block cross-validation residuals with location, aggregated across grid resolutions.